Rising Rivers
Massive Watershed
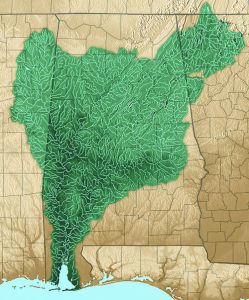
The Mobile Bay Watershed encompasses 65% of the land area for the state of Alabama. Also, includes portions of Mississippi, Georgia and Tennessee. Mobile Bay is the end-point for the Mobile, Tombigbee, Black Warrior, Alabama, Coosa and Tallapoossa Rivers. The watershed is a vast network of over 250 separate waterways, including rivers, bays, creeks, bayous, lakes, cutoffs, branches, and sloughs. *credit Mobilebaykeeper.com*
*detailed Alabama watershed map
Upstate Rainfall VS Local Rainfall
The total Mobile Bay watershed is approximately 45,000 sq miles . The local Mobile Bay watershed makes up less than 10% of this 45,000 sq miles. I consider any rainfall in Mobile, Baldwin, Washington and Clarke counties to be “local”. So, when we receive local rainfall most of it will flush out of the bays system in a few tide changes. However, upstate rain will take several days to accumulate above the dams scattered all over the state. Several days later before that water is released and reaches Mobile bay.
Watching the weather
Throughout the year, well nearly everyday I am watching the weather but not just the local stuff. Keeping an eye on the mid state regions like Montgomery, Birmingham, and Huntsville will help me understand the water quality cycles in Mobile Bay. Its kind of like a day trader watching stock trends and financial reports. Two inches of rain scattered over the the 40,000 sq miles is okay if it happens over a <24 hr period. However, two inches of rain in 2 hrs will fill the ditches, sloughs, and creeks ultimately sending large volumes of water down river.
Damn Dams
According to Wikipedia the Army Corp of Engineers reports that Alabama has over 2000 dams scattered over the state with over 30 that form major lakes and reservoirs. I personally watch water levels at 3 different dams. The first, Coffeeville at Tombigbee. Second, Claiborne Lock and Damn on the Alabama river. Then, Barry Steam Plant which is technically a river level gauge and not a dam.
*Click here for all water levels
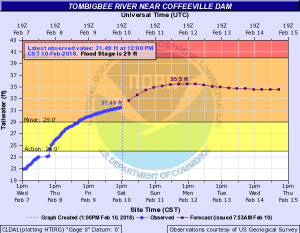
Tombigbee
What to know about watching the Tombigbee river graph. First, with any gauge you need to understand what is a “normal/good” level. In my experience a good level for the Coffeeville gauge as far as the bay is concerned is anything under 10′. When you see river stages flow up and down and remain under 10′ we will likely see very little change in water quality. Worst-case scenario is about 3 days after the crest you will see a little dingy water but this fresh dirty water will remain on top of the saltier denser water in the bay. Next stage is 15′-25′. When Tombigbee gets up into this range we will most certainly see muddy water and salinity drops. This will likely have more lingering affects on upper Mobile Bay and the lower delta. Final stage and most impact is any rise in the Tombigbee over 25′. This is the beginning of action stage and continues till major flood stage.
Rivers in Action and Above
On the rise into action stage and above. I am not worried about what action, flood, and major flood actually means to these particular dams. What I am concerned about is how the water will be managed by the dam. Will you see a sharp rise and sharp fall? Or will it be a sharp rise with a slow drop? If graph shows a sharp drop then we will have a large volume of water like a muddy water wave come rushing down the river and dragging all sorts of debris down river with it. These often cause extreme muddy conditons. The flip side is a slow drop which causes a slower feed of fresh muddy water down our way will certainly cause fresh and muddy conditions that could have lasting affects.
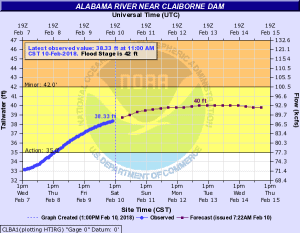
The Alabama
The Alabama drains approximately 22,000 sq miles and runs through the heart of the state. In my opinion you can see larger fluctuations in this river without affecting the upper bay and delta as much as Tombigbee. However, when the Alabama at Claiborne reaches action stage and above we are usually in for a big muddy mess coming our way. There are several river gauges on the Alabama but the most important for our area is the Claiborne.
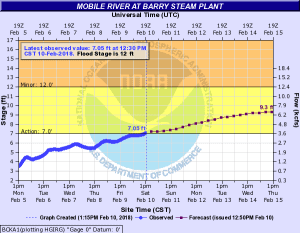
Barry Steam plant gauge (not a dam)
This is the true barometer for how the Bay and Delta are being affected by upstate rain (occasionally local rain can affect this gauge). As a saltwater fisherman who targets speckled trout, redfish and other saltwater fish this gauge is very important to monitor. Where do you want it read? I want to see it 2′-4′ and tidal. What does this mean? This means you want to see Barry Steam plant gauge going up at high tide and down with low tide. This means that the tide has more influence than outflow of the Alabama and Tombigbee. What happens when you lose the tidal motion? You are being influenced by a larger volume of fresh water coming down river. We will begin to see dirtier and fresher water as soon as Barry begins to read over 5′ and will only get worse as it continues to rise. The one thing you will notice is once Barry is over 5′ you will have a constant flow moving down river regardless of what the tide is doing.
Upstate rain
Upstate rain has a massive and long lasting affect on local Mobile Bay water quality and fishing. The length of time each significant upstate rain event will affect our area is only a guess. If we had good conditions in the bay and delta then we get a significant rise in both the Alabama and Tombigbee, I expect this rise to fully cycle with in a two week period. If the bay conditions were already poor then it can take 3-6 weeks to fully cycle out of the system. So, as you can see large amounts of upstate rain are bad business for the Mobile Bay water quality.
Flip-side
Despite the water clarity and salinity being affected by this upstate rain its not all bad. These upstate rain events wash nutrients of all types into the water which can stimulate healthy algae blooms. Well, too much algae can cause issues but looking at this optimistically we know that algae is an intricate part in a healthy fishery. These nutrients and algae blooms will supply zooplankton, fish, shrimp, and other crustaceans much needed food for their survival. So, these rain events will likely suppress the fish catching but its essential for a healthy ecosystem.
Both Upstate and Local
In the Summer of 2017 we experienced extremely low salinity and awful water clarity due a tropical stormed named Cindy. She was a real b-i-t-c-h. She slugged the local Mobile Bay watershed area with torrential downpours and flash floods then slid up state dishing out equal and even worse punishment. Then followed by more local rainfall which had nowhere to go because of all the fresh water coming down. We saw salinity levels plummet to as low as 2ppt which is basically tap water. Saltwater fish like speckled trout were very difficult to catch unless in the higher salinity areas near the west end of Dauphin Island and along the gulf beaches. When the bays water was at its worse I actually went 7 miles south of Mobile Bay into the gulf before I could taste salt in the water. This was an event I hope we don’t have to repeat anytime soon.
Recap of Mobile Bay watershed
Copy the links in the beginning of this post and monitor these river gauges. They will make deciding on where to go and how to fish a lot easier than going and figuring it out after you launch the boat. Upstate rain has the most lingering affects on Mobile Bay both positive and negative. Local rains have the least impact and will usually flush out of the Bay’s system with in a week. Thanks for reading. Share with other Mobile Bay fisherman and look for an article in the future about fishing tactics when the rivers rise.
**As always if you need a fishing guide or a multi-boat charter please contact us here **
[…] arrives it usually brings rain to our area and throughout the entire Mobile Bay watershed. The Mobile Bay watershed consists of local and upstate watersheds. Heavy local rain will typically flush out of the smaller […]